
You have seen it. The wheel of nutrients with arrows running between them, antagonism one colour and synergism another. It shows up in every micronutrient presentation in the country, usually about slide six, usually with the phrase “everything is connected.”
Then the next slide is a product.
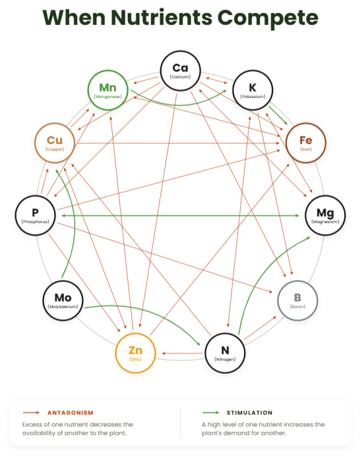 The chart is not the problem. Mulder published it in 1953 and the relationships in it have held up for seventy years. The problem is what gets left off when it goes on a slide, because a chart of arrows tells you the direction of an interaction and nothing else.
It does not tell you how big the effect is. It does not tell you at what level the interaction starts to matter. It does not tell you where in the system it happens, in the soil or in the plant. And it does not tell you when in the season it happens.
Those four things are the entire difference between a diagram and a decision. Here is where to get them for the interaction that matters most on prairie ground.
The one arrow worth planning around
Of every antagonism on the chart, phosphorus against zinc is the one with the most acres behind it. High-phosphorus fertility programs are the norm across most of the territory, zinc tests deficient in 66 percent of Saskatchewan samples, 61 percent in Manitoba and 30 percent in Alberta (Murrell et al., 2016), and the two things are sitting in the same soil.
So how big is it, actually?
A meta-analysis of 51 studies across 43 locations put a number on it. Phosphorus application reduced grain zinc concentration by 16.6 percent in wheat and 20.2 percent in maize. In rice there was no significant effect.
That is not a rounding error and it is not a curiosity. It is a fifth of the zinc in a corn crop.
The part that changes what you do about it
Here is where the conventional explanation goes wrong.
The usual story is that phosphate and zinc react in the soil, form insoluble zinc phosphate, and the zinc is locked away. It is a satisfying story because it happens in a place you can fertilize, which means the implied answer is to apply more zinc.
The evidence does not support it as the main pathway.
In the same meta-analysis, phosphorus application reduced root zinc concentration by 9.94 percent, and it did so independently of any change in soil zinc availability. Translocation inside the plant was unaffected, with no change in shoot-to-root or grain-to-straw ratios. The zinc was not stuck in the soil and it was not stuck in the stem. It was not being acquired by the root in the first place.
The clearest mechanism the authors found was biological. Phosphorus application reduced arbuscular mycorrhizal colonization of roots by 31.5 percent in wheat and 41.5 percent in maize, and the drop in colonization tracked the drop in zinc.
Which makes sense once you say it plainly. A well-fed plant stops paying for the service. Mycorrhizal fungi extend the effective root system well beyond the depletion zone the root creates on its own, which matters enormously for a nutrient that only diffuses a millimetre or two. When soil phosphorus is high, the plant reduces its investment in that partnership, and it loses the zinc acquisition that came with it as a side effect.
Two consequences for a fall recommendation.
-
Your soil test will not warn you. If the zinc is not being precipitated out of solution, extractable zinc can hold steady while uptake falls. The report says adequate and the plant disagrees, which is the exact pattern September described from a different angle.
-
More zinc in the box is the wrong end of the problem. If acquisition at the root is the constraint, raising the rate of a broadcast source that is already fixing in place adds cost without adding uptake. Recovery of applied zinc fertilizer runs under one percent as it is.
Learn How Soil Microbes Drive Nutrient Availability
Which Fields This Actually Applies To
This is where it gets useful, because the mycorrhizal pathway is not available in every phase of a prairie rotation.
Canola and the other brassicas are non-mycorrhizal. They do not form the association, so the AMF mechanism does not explain zinc behaviour in a canola year, and it also means canola leaves behind a soil with reduced fungal inoculum for whatever follows.
That matters most for flax, which is heavily mycorrhizal-dependent and which prairie agronomists have watched underperform after canola for years. Wheat, corn, pulses and flax all use the pathway. Canola does not, and it degrades the pathway for the next crop.
So the practical read:
Flax or pulses following canola. Highest risk field on the farm for this specific mechanism. The crop needs the partnership and the previous crop reduced the inoculum. Heavy phosphorus on top of that stacks a third factor onto it.
Wheat or corn in a high-P program. The meta-analysis numbers apply directly. Worth checking tissue, not just soil.
Canola. Different problem. Zinc and iron behaviour here is governed by pH, carbonate and the same diffusion limits everyone deals with, without the biological layer. Source and placement carry the load.
One chart, four fields, four different answers. That is what operational looks like.
The Arrows That Really Are Soil Chemistry
Not everything on the chart works this way, and it is worth separating the two.
Some interactions genuinely are solution chemistry, and those you can read off a soil test if you look at more than the micronutrient lines.
pH is the big one. Zinc solubility falls roughly a hundredfold for every one-unit rise, and manganese, iron and copper follow. Above about 7.5 the soil can hold a respectable extractable number and still supply the crop poorly. This is a real, measurable, plan-able constraint.
Organic matter binds copper. Which is why copper deficiency shows up on high-OM soils that look like they should have plenty.
Iron and zinc compete for the same uptake sites at the root, so a heavy correction of one can induce a shortage of the other. Applying a micronutrient blend without knowing which of the two is limiting can make the situation worse rather than better.
Potassium against magnesium and calcium is straightforward cation competition, and it is the one interaction on the chart that most people already manage properly.
Read those four alongside pH and organic matter and the chart starts behaving like a diagnostic instead of a poster.
Right Time Means The Release Curve, Not the Calendar
October’s other half is timing, and timing usually gets discussed as a question of when you drive across the field.
That is the smaller half of it. The larger question is what the nutrient does after you leave.
Crop demand for micronutrients is not flat. Zinc demand is heavily front-loaded, tied to early root development and to the enzyme systems running during tillering and early vegetative growth. Boron demand peaks much later, at flowering and seed set.
A water-soluble source releases on contact with moisture. All of it, at once, regardless of what the crop is doing. On a high-pH soil that pulse enters solution and starts fixing immediately, so a spring-applied sulfate can be substantially unavailable before the crop reaches the growth stage that needs it. The application was timed correctly. The release was not.
This is the useful way to think about Right Time for a micronutrient. Not “when did you apply it” but “what governs when it becomes available.”
Chemical release is governed by pH, carbonate content and redox. Biological release is governed by soil temperature, moisture and microbial activity, which is the same list that governs root growth and crop demand. One of those tracks the season. The other runs on its own schedule.
Where Soileos Fits
Soileos holds micronutrients in a cellulose matrix built from upcycled lentil and oat hulls. The nutrient is not free in solution waiting to react. Soil microbes have to break down the carrier before it is released.
Two things follow from that.
The nutrient is not fully exposed to a fixing soil on day one, so it is not fully fixed by day thirty. Release happens in increments across the period the crop is drawing on it.
And the carrier is 54 percent organic matter, which is substrate for the same biology doing the releasing. In trials completed with Agriculture and Agri-Food Canada in 2020,microbial biomass came back more than 20 percent higher than the control.
There is a detail in our own yield data worth putting on the table here rather than leaving out. Across three years of field trials the average response was 10 percent in corn, 10 percent in wheat, 12 percent in soybeans and 8 percent in canola. Canola is the lowest of the four, and canola is also the only one of the four that does not form mycorrhizal associations. One dataset is not a mechanism and we are not presenting it as one. But it points the same direction as the rest of this post.
Given that the phosphorus-zinc antagonism runs substantially through root-zone biology rather than soil chemistry, a source that works through biology rather than against chemistry is at least arguing on the right terrain. We are not claiming Soileos restores mycorrhizal colonization. That has not been tested. What we can say is that the constraint sits at the root, and so does the release mechanism.
What to Carry into Next Seasons plan
-
Use the chart for direction, not for decisions. It tells you which interactions exist. It does not tell you which ones are limiting on your field. Only pH, organic matter, phosphorus level and rotation history do that.
-
Read phosphorus level as a zinc risk factor, not just a phosphorus number. Especially on wheat and corn, and especially where a flax or pulse crop is following canola.
-
Ask what governs release, not just when you applied. If the source dumps its load into a fixing soil in April, the calendar was never the variable.
-
Balance is not about applying more of everything. It is about knowing which arrow on that chart is actually pointing at your field.
-
Run your Soil Analysis Report. Upload a recent soil test and find out where your nutrients are getting stuck.

It all starts with a Soileos test.
FREQUENTLY ASKED QUESTIONS
What is Mulder’s Chart? A diagram published by Mulder in 1953 showing which plant nutrients interfere with one another and which help. It shows the direction of each interaction. It does not show how large the effect is, at what level it starts to matter, or whether it happens in the soil or in the plant.
Does phosphorus fertilizer cause zinc deficiency? It reduces zinc in the crop measurably. Across 51 studies, phosphorus application lowered grain zinc by 16.6 percent in wheat and 20.2 percent in maize. Whether that becomes a visible deficiency depends on how much zinc was available to begin with.
Is phosphorus locking up zinc in the soil? That is the common explanation and it is not the main pathway. The evidence points to reduced zinc acquisition at the root, including a 31.5 to 41.5 percent drop in mycorrhizal colonization under phosphorus application, rather than to zinc being precipitated out of the soil solution. It means the shortfall can occur without the soil test moving.
Why does flax do poorly after canola? Flax depends heavily on arbuscular mycorrhizal fungi for phosphorus and zinc uptake. Canola is non-mycorrhizal and leaves reduced fungal inoculum behind it. A flax crop following canola starts with a weaker uptake pathway, and heavy phosphorus fertility makes it worse.
Can I fix an antagonism by applying more of the nutrient that is short? Sometimes, if the limitation is genuinely quantity. Often not. If the limitation is acquisition or transport, raising the rate of a source that is already fixing in place adds cost rather than uptake. Under one percent of applied zinc fertilizer is recovered by the crop.
Does soil pH matter more than nutrient interactions? On most prairie fields, yes. Zinc solubility falls about a hundredfold for every one-unit rise in pH. The decline becomes measurable above roughly 6.5 and becomes a practical constraint above 7.5, where free lime is usually present and zinc precipitates as hydroxide and carbonate. Read pH first, then interactions.
When should micronutrients be applied relative to crop demand? Zinc demand is front-loaded, tied to early root and vegetative growth. Boron demand peaks at flowering and seed set. What matters more than the application date is what governs release, because a source that becomes unavailable before the crop reaches the relevant stage was mistimed no matter when it went on.