
A soil test reports what a lab extractant pulled out of your sample. It does not report what your crop can reach. That gap between presence and access is why fields testing "adequate" still respond to micronutrients, and why raising the rate rarely closes it. Here are six ways fall sampling sharpens your rate and placement decisions for next season.
Post-harvest is the one window in the year when the data arrives before the decision.
The crop is off (or coming off). Samples are going in. Next season's nutrition plan is beginning to formulate.
Ensure your soil test is being used as a strong tool not just a record or addition and subtraction. Most fall plans treat the report as an inventory. There is 1.2 ppm zinc present, so there is 1.2 ppm zinc available. There isn't. A soil test tells you what a lab extractant pulled out of your sample. It does not tell you what a root can reach in your field.
That difference is the access gap. Here are six ways sampling shapes what you do about it.
1. Your Soil Test Reports Presence. Reading It Well Reports Access.
Micronutrient values on a prairie soil report come from a DTPA extraction, with water extraction for boron. DTPA is a chelate. It strips a labile fraction of zinc, manganese, iron and copper off soil surfaces under standard lab conditions. That fraction correlates with crop response well enough to be useful. It is not a measurement of what your plant will get.
Two fields can return the same 1.2 ppm zinc and behave nothing alike.
What governs uptake is the concentration in soil solution right at the root surface, and how fast your soil can resupply it. pH, CEC, organic matter, moisture, temperature, compaction and phosphorus loading all sit between that number and the plant.
Read the number as a starting position, not a balance.
2. It Puts Right Rate and Right Place in the Right Order.
Nutrients reach roots three ways, and they are not interchangeable.
Root interception. The root grows into contact with the nutrient. Small contribution overall.
Mass flow. The nutrient travels dissolved in water pulled toward the root by transpiration. This supplies most nitrate, sulfate, calcium, magnesium and boron.
Diffusion. The nutrient moves down a concentration gradient across a very short distance, usually a millimetre or two, into the depletion zone the root has already created. This is the main route for phosphorus, potassium, zinc, manganese, iron and copper.
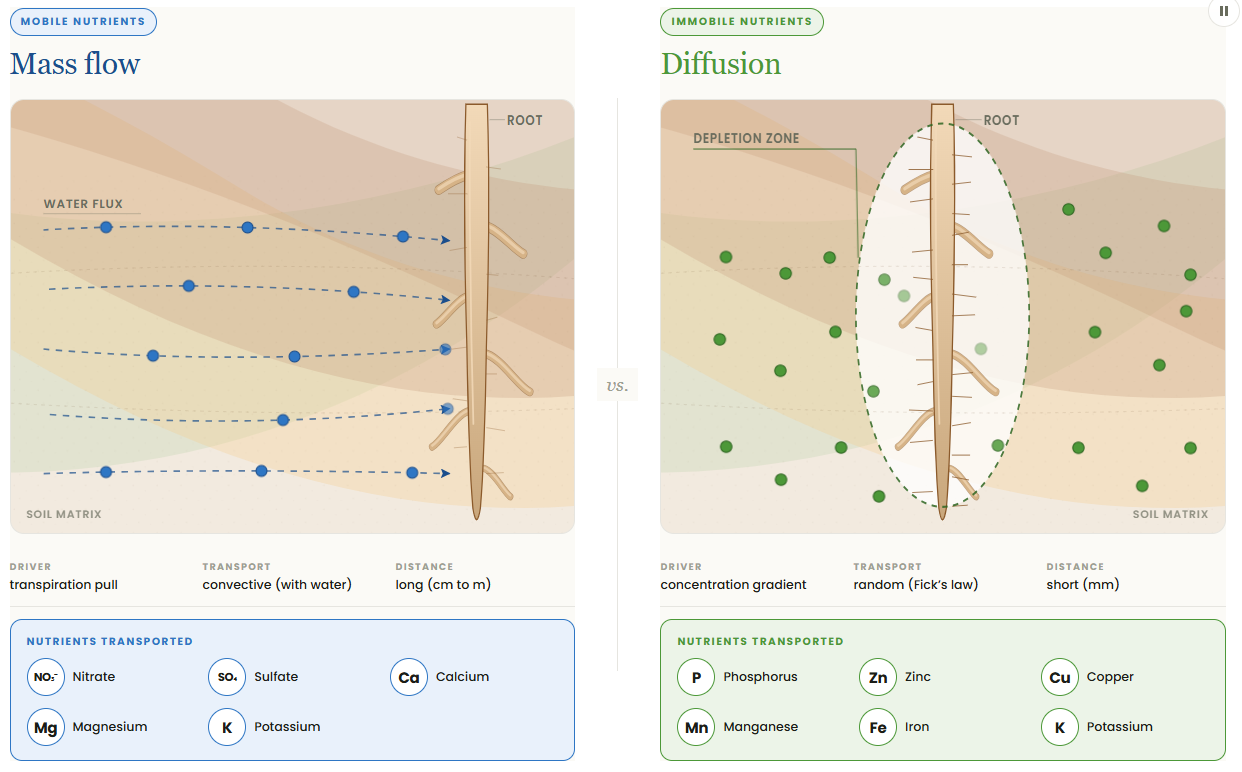
Here is what that means on your acres. For the diffusion nutrients, total quantity in the soil matters far less than concentration near an actively growing root. Diffusion is slow, distance limited and moisture dependent. A dry seedbed, a cool spring, or a compaction layer that keeps roots from exploring will produce a deficiency response on soil that tested adequate.
The nutrient never had to leave your field to be unavailable. It only had to sit more than two millimetres from a root.
This is why placement carries more weight for zinc than it does for nitrogen. It is also why raising the rate of a broadcast micronutrient rarely buys what the arithmetic promises. Recovery of applied zinc fertilizer in agricultural soils runs under 1 percent (White & Broadley, 2005). The rest is still out there, adsorbed, precipitated, or simply out of reach.
No rate fixes a transport problem.
Learn why Soil Test Levels dont match crop uptake
3. It Turns pH From a Footnote Into a Decision.
Micronutrient availability is strongly pH dependent, and most prairie fields sit in the range where it matters. Zinc solubility falls roughly a hundredfold for every one unit rise in soil pH. Manganese, iron and copper move the same direction. Above about pH 7.5, your soil can hold a respectable extractable number and still, poorly supply the crop.
Organic matter cuts both ways. It is a reservoir, but it also binds copper tightly, which is why copper deficiency turns up on high OM soils that do not look deficient. Heavy phosphorus loading can induce zinc deficiency in a soil with adequate zinc.
pH also limits what a correction can do. Oxy-sulphate micronutrients have low water solubility in alkaline soils. On the fields carrying the most deficiency risk, the most common correction is working at its weakest. That is a source question, and fall is the time to flag it.
You are pulling a soil sample anyway. pH and organic matter cost almost nothing to add, and they change how every micronutrient line on the report should be read.
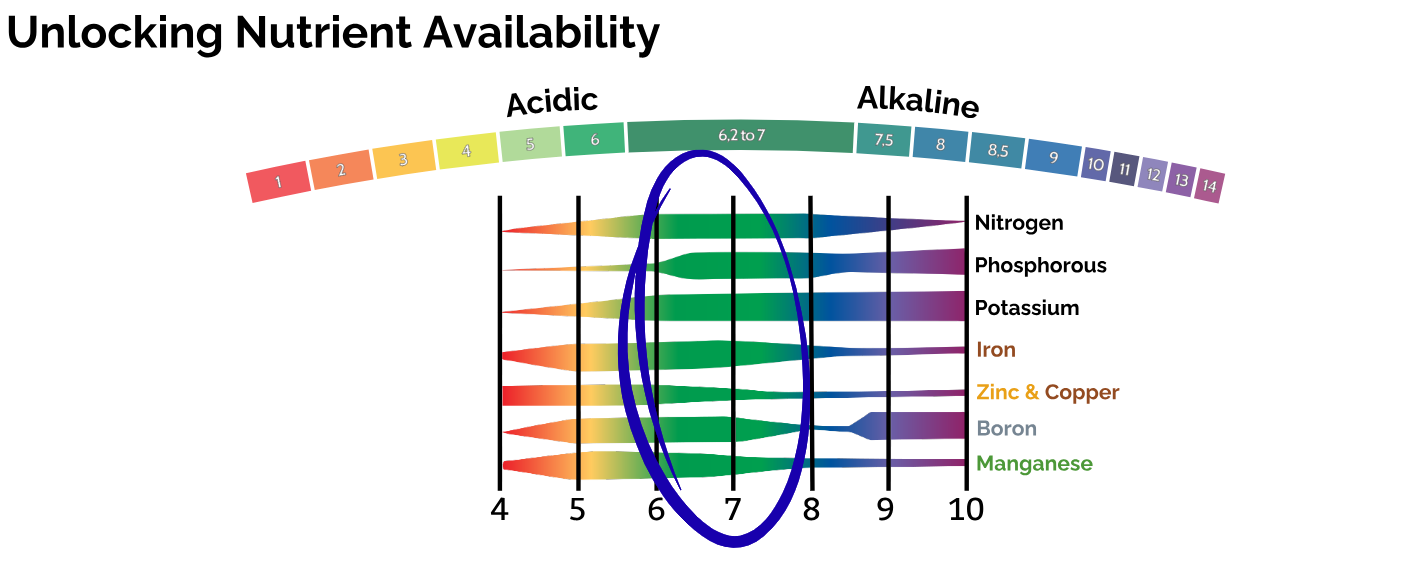
When your pH falls outside the sweet spot. Nutrient availability becomes problematic.
4. It Stops Micronutrients Getting Dropped by Default.
 Micros come off the Soil analysis because they are an add-on line and the response is harder to predict than N or P. Reasonable instinct — and an expensive one.
In the Canadian Soil Test Summary, zinc came back deficient in 30 percent of Alberta samples, 61 percent in Manitoba and 66 percent in Saskatchewan (Murrell et al., 2016). Two out of three Saskatchewan fields is not an edge case. It is a default worth checking.
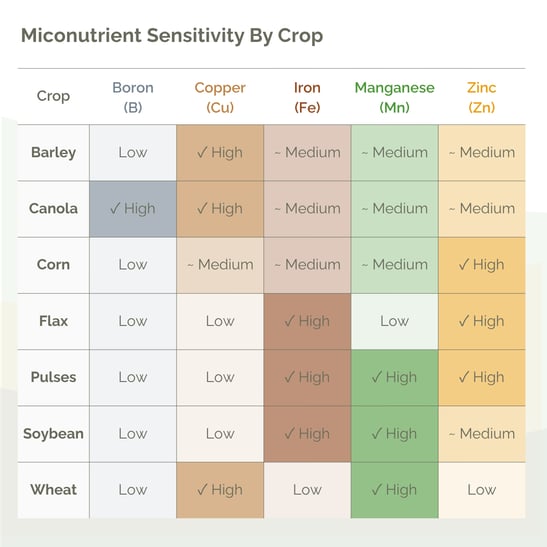
The crops that respond are not evenly spread either. Crops with the greatest sensitivity to micronutrients often respond the greatest to a balance and available nutrient plan.
Reference ranges for deficiency rating for soil test results. Note values are based on DTPA extraction, except Boron (water extractable)
|
Nutrient |
Deficient |
Adequate |
Deficiency conditions |
|---|---|---|---|
|
Below 0.5 ppm |
0.5 to 2.0 |
Sandy, high pH, low OM |
|
|
Below 0.2 ppm |
0.2 to 0.5 |
Organic soils, high pH |
|
|
Below 4.5 ppm |
4.5 to 10.0 |
High pH, waterlogged |
|
|
Below 2.0 ppm |
2.0 to 5.0 |
High pH, high OM |
|
|
Below 1.0 ppm |
1.0 to 3.0 |
High pH, sandy, low OM |
A flax or pulse rotation without iron and zinc on the testing regime is a plan built on an incomplete report.
5. Field Results Keep Landing on the Wrong Side of "Adequate."
Across our own trial work, the sites that responded were not only the deficient ones. Several fields testing in the adequate range still returned a measurable yield response to a micronutrient application.
|
Site |
Year |
Crop |
Soil test |
vs. reference |
Response |
|---|---|---|---|---|---|
|
Saskatoon, SK |
2022 |
Wheat |
Zn 3.1 ppm |
Top of adequate |
+5 bu/ac (+7%) |
|
Saskatoon, SK |
2022 |
Canola |
Fe 64.4 ppm |
6x top of range |
+5 bu/ac (+21%) |
|
Lethbridge, AB |
2023 |
Canola |
Zn 1.2 ppm, pH 7.5 |
Adequate |
+4 bu/ac (+4%) |
|
Lethbridge, AB |
2024 |
Potato |
Zn 1.3 ppm, pH 7.9 |
Adequate |
+13 cwt/ac (+3%) |
|
Abbotsford, BC |
2021 |
Peppers |
Zn 2.0 ppm |
Adequate |
+7% |
|
Abbotsford, BC |
2021 |
Tomatoes |
Zn 1.2 ppm |
Adequate |
+10% |
The two BC sites are irrigated horticulture on acidic sandy loam, pH 4.9 and 5.7, where the constraint is leaching from a low CEC soil rather than high pH tie-up. Different mechanism, same outcome. An adequate reading that did not hold.
Set those against the clearly deficient sites. Leroy, SK at 0.3 ppm zinc and pH 8.1 returned 4.5 bu/ac on wheat. Plenty, SK at 0.5 ppm zinc returned 4 bu/ac on durum. The extractable zinc number from the soil test did not sort the sites by how much they responded.
These are grower strip trials and small plot work across different years, sites and seasons. They do not establish a statistical ranking and we are not presenting them as one. What they do show is worth carrying into a fall recommendation. An adequate reading is not a reliable all clear — least of all above pH 7.5.

6. One Test Is a Snapshot. A Record Changes Decisions.
The most useful thing about fall sampling is that it repeats.
A single year of zinc data tells you where you stand. Four years of the same benchmarks, pulled the same way from the same zones, tells you whether pH is drifting, whether organic matter is holding, and whether your micronutrient program is moving the extractable pool or just feeding the crop.
Consistency beats precision here. Same depth, same timing relative to harvest, same zones, same lab. A sloppy series is worth less than one careful test.
What This Means for Your Fall Recommendation
Your soil test is a diagnostic, not a compliance step. Read as an inventory, it will overstate what your crop is going to get. Most reliably on high pH, low OM and high phosphorus fields. Most often on the micronutrients that move by diffusion.
Three things to carry into next season's plan.
- Treat extractable numbers as an index. Read them alongside pH, organic matter and phosphorus.
- Ask whether the shortfall is supply or access before you touch the rate. Access problems respond to source and placement, not to more product.
- Put micros on the testing for responsive crops. Flax, pulses, corn and canola earn it.
Recognize the gap. Respond with the right source and placement. Reap the difference.
Run your Soil Analysis Report. Upload a recent soil test and see where presence and availability are most likely to part ways on your fields.
It all starts with a Soileos test.
